


Kurdistan Region Oil Production and Revenue in 2024
Analysis Reveals $5.5 Billion Potential Loss Due to Price Differential in 2024.
According to a report by the Roonbeen Organization for Transparency in the Kurdistan Region’s oil sector, oil production and revenue data for 2024 reveal significant disparities in pricing and revenue allocation.
Key highlights include:
- Oil was extracted from eight oil fields across the region.
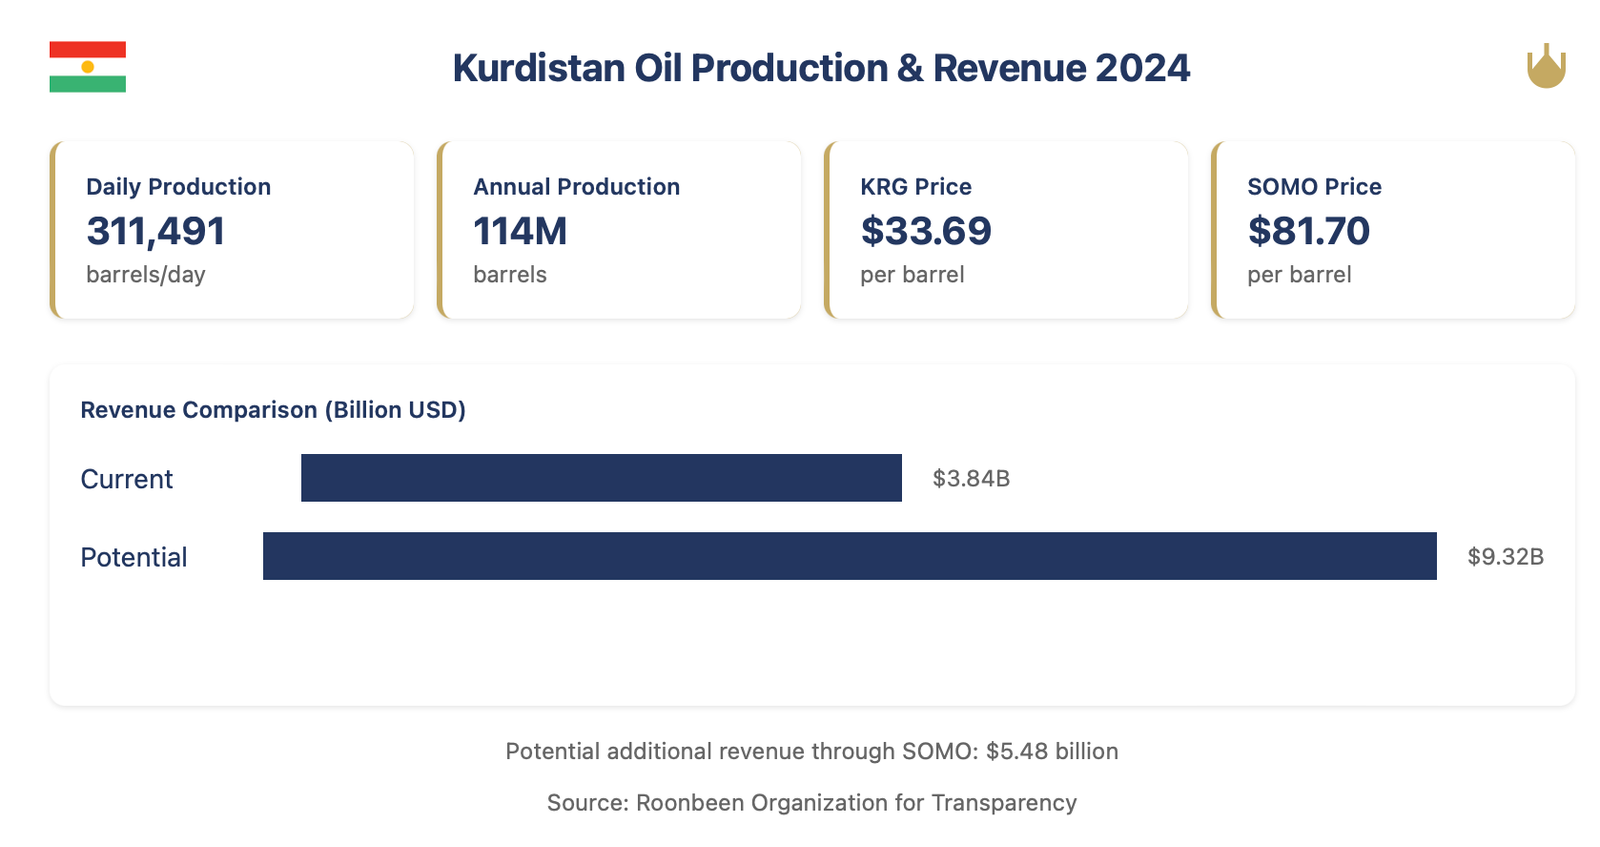
- The average daily oil production stood at 311,491 barrels.
- The total annual oil production amounted to 114,005,815 barrels.
- Total oil revenue for the KRG reached $3,841,484,635.
- The average selling price per barrel in the Kurdistan Region was $33.69, significantly lower than the $81.70 per barrel achieved by the Iraqi government through SOMO.
- If the Iraqi government had handled the Kurdistan Region’s oil sales, total revenue could have reached $9,324 million, instead of the $3,841 million reported.
Average Daily Oil Production of the Kurdistan Region During 2024
| Oil Fields | Daily Production Average | Total Production (Barrels) | Companies’ Share (Barrels) | KRG Share (Barrels) | Percentage |
|---|---|---|---|---|---|
| Tawke (Peshkhabur) | 79,765 | 29,194,115 | 8,950,843 | 20,243,272 | 69.3% |
| Sarsang | 33,234 | 12,163,600 | 6,105,413 | 6,058,187 | 49.8% |
| Atrush | 25,052 | 9,169,040 | 2,998,319 | 6,170,721 | 67.3% |
| Sheikhan | 40,688 | 14,891,780 | 6,429,912 | 8,461,868 | 56.8% |
| Khurmala | 114,973 | 42,080,000 | 6,312,000 | 35,768,000 | 85.0% |
| Hawler | 8,585 | 3,142,200 | 932,047 | 2,210,153 | 70.3% |
| Garmian (Sarqala) | 9,194 | 3,365,080 | 1,346,032 | 2,019,048 | 60.0% |
| Total | 311,491 | 114,005,815 | 33,074,566 | 80,931,249 | 71% |
The Kurdistan Region operated eight oil-producing fields in 2024, achieving a daily production average of 311,491 barrels. This translated to an annual production volume of 114,005,815 barrels, with production sharing agreements allocating 71% (80.9 million barrels) to the KRG and 29% (33.1 million barrels) to participating oil companies
Total Oil Revenue of the Kurdistan Region During 2024
| Oil Fields | Daily Production Average | Total Production (Barrels) | Total Revenue (USD) | Companies’ Share (USD) | KRG Share (USD) | Percentage |
|---|---|---|---|---|---|---|
| Tawke | 79,765 | 29,194,115 | 1,034,564,788 | 315,714,465 | 718,850,324 | 69.5% |
| Sarsang | 33,234 | 12,163,600 | 486,691,556 | 244,290,945 | 242,400,611 | 49.8% |
| Atrush | 25,052 | 9,169,040 | 301,191,253 | 98,422,576 | 202,768,677 | 67.3% |
| Sheikhan | 40,688 | 14,891,780 | 404,073,918 | 174,469,829 | 229,604,088 | 56.8% |
| Khurmala | 114,973 | 42,080,000 | 1,388,640,000 | 208,296,000 | 1,180,344,000 | 85.0% |
| Hawler | 8,585 | 3,142,200 | 95,085,000 | 28,204,343 | 66,880,657 | 70.3% |
| Garmian (Sarqala) | 9,194 | 3,365,080 | 131,238,120 | 52,495,248 | 78,742,872 | 60.0% |
| Total | 311,491 | 114,005,815 | 3,841,484,635 | 1,121,893,406 | 2,719,591,229 | 70.8% |
The region’s total oil sales generated $3.84 billion in revenue, distributed between the KRG ($2.72 billion) and oil companies ($1.12 billion). However, a significant price differential emerged between Kurdistan’s oil sales and those managed by Iraq’s State Organization for Marketing of Oil (SOMO). While Kurdistan’s oil averaged $33.69 per barrel, SOMO achieved an average price of $81.70 per barrel – a difference of $48 per barrel. This price differential had substantial financial implications. Had Baghdad marketed Kurdistan’s oil through SOMO channels, the potential revenue could have reached $9.32 billion – representing a theoretical opportunity cost of $5.47 billion for the region.
The full report in Kurdish is available here.


